Sandboxes Dashboard
The Sandboxes dashboard displays current, future and historic sandboxes that either you created or were created by users within domains you are permitted to access. It provides an overview of the current state of each sandbox, and a central place from which you can view and access sandboxes. Sandboxes are colored according to their present state - see Filtering sandbox state (Administrators only).
There are two types of environments in CloudShell Pro and both are displayed and managed from the Sandboxes dashboard: regular time-limited sandbox environments and persistent environments that have no end time. For details, see Persistent Sandboxes Overview.
The Global domain lets you see sandboxes from all the domains you are permitted to access including the Global domain, while logged in to a non-Global domain, you only see that domain's sandboxes.
Navigating the Sandboxes Dashboard
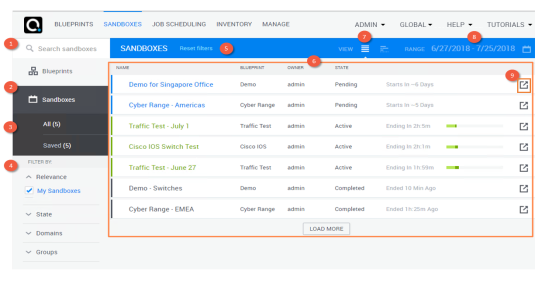
In the image below, hover over an area or option to learn more about it, or use the table that follows.

| 1 | Run a free text search for sandboxes listed in the dashboard. For example, you can search for sandboxes by name or sandbox id. The search also applies to restored sandboxes. |
| 2 | Switch between the Sandboxes dashboard and the Blueprint Catalog. |
| 3 | Display the All Sandboxes dashboard or the Saved Sandboxes dashboard. The Saved menu option requires the Save and Restore paid add-on. For details about Save and Restore, see Sandbox Save and Restore Overview. |
| 4 | Use the filters to find sandboxes matching specific criteria. |
| 5 | The dashboard header enables you to view and filter the sandboxes list according to time range, and reset all filters to their default settings. |
| 6 | The main work area lists past, present and future sandboxes. Click a sandbox to open its diagram. |
| 7 | Display sandboxes in a list or timeline. |
| 8 | Time range filter |
| 9 | Click this button to view additional details about the sandbox, and access sandbox management options, like Delete, Extend, and End. |
In this article:
Searching for sandboxes
Typing any text into the quick search box displays the matching sandboxes. You can search by sandbox name, sandbox ID, blueprint name, owner, sandbox description, and current live status of the sandbox.
Filtering the Sandboxes dashboard
Note: The portal remembers the filters selected and the time range specified in the Sandboxes dashboard.
Filtering sandboxes by time range
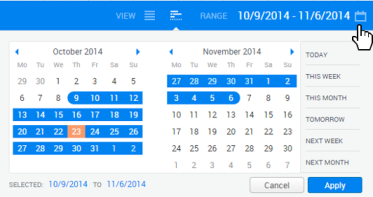
The Range filter sets the time range borders which the user operates in. To navigate beyond these borders, select a broader time range. You can update the range filter by clicking the calendar icon next to the range label.

To determine the range:
- Either select one of the predefined ranges from the right pane or manually indicate the start and end dates from the calendar.
Working with the sidebar Filter options
Filtering sandboxes created by me
If you have the necessary permissions, the My Sandboxes check box will be available in the left sidebar. Select it to display sandboxes of other users. Clear it to display your sandboxes only.
Filtering Historic, Current, or Future sandboxes (Non administrators only)
The Sandboxes filter group in the left sidebar allows users to select one or more of the three different views. Each view displays sandboxes at different stages:
- Current - Shows only sandboxes that are currently active, including overtime sandboxes and sandboxes going through the setup or teardown stages
- Scheduled - Shows only sandboxes scheduled for a future time
- Historic - Shows only completed sandboxes
Filtering sandbox state (Administrators only)
The State filter group is visible to administrators only. It enables you to filter sandboxes by their current state. The sandbox state can be one of the following:
|
State |
Description |
|---|---|
|
|
Sandbox is scheduled for future use. |
|
|
Setup command is currently running. Sandbox is not available for use. During setup, CloudShell reserves the sandbox's resources for the sandbox's time slot, and deploys layer 2 connections and Apps. |
|
|
Sandbox is currently active and ready for use. |
|
|
Sandbox is currently active and ready for use. Setup was not completed successfully. |
|
|
Teardown command is currently running. Sandbox is not available for use. During teardown, CloudShell releases the sandbox's resources to allow others to use them, powers off the Apps and deletes them from the cloud provider, and disconnects layer 2 connections. |
|
|
Sandbox ended and is not available for use. The sandbox is no longer considered active and does not hold any resources. |
|
|
(Requires the |
 Saving Saving |
Save command is currently running. Once saving is complete, status returns to Active. You can only save a sandbox that is Active or Active (with Error). For additional information, see Save a Sandbox. |
|
|
Sandbox ended with errors (Teardown process failed). Note that resources in "Completed (with Error)" status are no longer considered reserved. However, the sandbox will remain in this state until you manually clean up the sandbox's infrastructure and then rerun the sandbox's Teardown process. |
For actions that are permitted during each of the sandbox states, see Permissible actions according to sandbox status
Domains (Administrators only)
An additional filter, visible to administrators only, allows filtering sandboxes by their relation to a domain.
Groups (Administrators only)
An additional filter, visible to system administrators in the Global domain, allows filtering sandboxes by domain.
Filtering sandboxes by live status
You can search for sandboxes by live status by typing the name of the live status in the quick search box (for example, "downloading"). Partial search words are supported. The sandboxes that match the specified status will be displayed. You can apply additional filters to the displayed results (for example, by selecting one or more of the filter options in the left sidebar) to display only those live status sandboxes that match the additional criteria.
Performing quick actions on selected sandboxes
To display the actions toolbar:
- In List view, in the required sandbox row, click the
 More Info button.
A pop-up window with the sandbox details and toolbar opens.
-or- - In Timeline view, in the timeline, click the required sandbox.
The toolbar is displayed.
The following actions can be performed on the selected sandbox:
|
Tool |
Action |
|---|---|
|
Delete |
Deletes the sandbox completely from the system and releases its resources for the time frame of the sandbox. Only completed or pending sandboxes may be deleted instantly, whereas to delete an active sandbox you need to end it first. |
|
Extend |
Extends an active or pending sandbox by a specific duration or to a specific new end time. |
|
End |
Ends a sandbox before its planned end time. Ending a sandbox will first trigger any teardown procedures defined for it and then transition the sandbox to a Completed state. |
|
Properties (Update) |
Opens the Update dialog box where you can update the sandbox start and end times, add or remove permitted users, control email notifications and more. |
|
Open |
Opens the sandbox diagram. For active sandboxes, the diagram is the main page to carry out provisioning operations and manage connectivity. Important: Once you delete a blueprint, any historic sandboxes from this blueprint will no longer display the contents of their diagrams. |
|
Find alternate time slots |
This action is only available for future sandboxes which have conflicting resources. When selected, a dialog box is displayed with suggested alternative time slots for the sandbox, where you can select one and update the sandbox to resolve the conflicts easily. |
 Pending
 Setup
Setup Active
 Teardown
 Completed
 Overtime
 Completed (with Error)