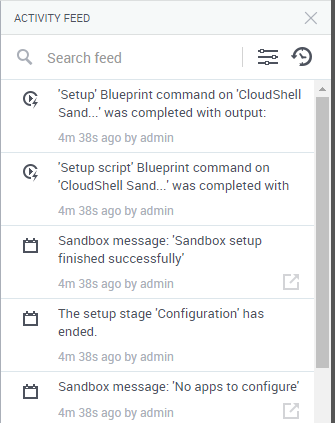
Activity Feed Pane
The Activity Feed displays information about actions performed in the sandbox by the user and automation processes. This includes information related to blueprint and resource commands, as well as actions performed in the sandbox, such as adding resources to the sandbox workspace, running commands, and changing the end time of the sandbox.
The Activity Feed also enables you to display information for a specific component in the sandbox. For additional information, see Activity Feed for a Resource in the Sandbox.
- The
 button indicates the number of unread entries in the Activity Feed.
 - The retention period for sandbox events data is controlled by the
SandboxLogAndOutputSaveDurationadmin configuration key.
To open the Activity Feed:
-
In the Diagram toolbar of the Sandbox workspace, click the
 button.
The Activity Feed is displayed on the right, listing the last 30 entries.

Tip: Scroll to the bottom to display additional entries.
- To change the time format of the entries, click the
 button. By default, the time elapsed is displayed for each entry.
 -
To narrow down your search for entries, use the search and filtering options. Click the
 button to show the filters.
Note that the search and filters apply to all entries in the Activity Feed, not just the last 30.
- Search feed field: search for entries that include a word or phrase (case-sensitive).
- Error option: display errors that occurred in the sandbox
- Has output option: display entries that have an output
- Component drop down list: display entries that are related to a specific resource, App or service in the sandbox. The value Component displays entries for all components.
- Activity type drop down list: display entries according to the source of the activity. Values are: Event type (all entries), Command, Resource, Service and Sandbox (sandbox commands).
For more detailed information about a particular error, see the Activity Details window below.
